by weaver | Jan 14, 2023 | 2022 Report, Highlight
Roots Community Food Centre
Designed for staff and volunteers working with social service organizations who support people accessing emergency food.
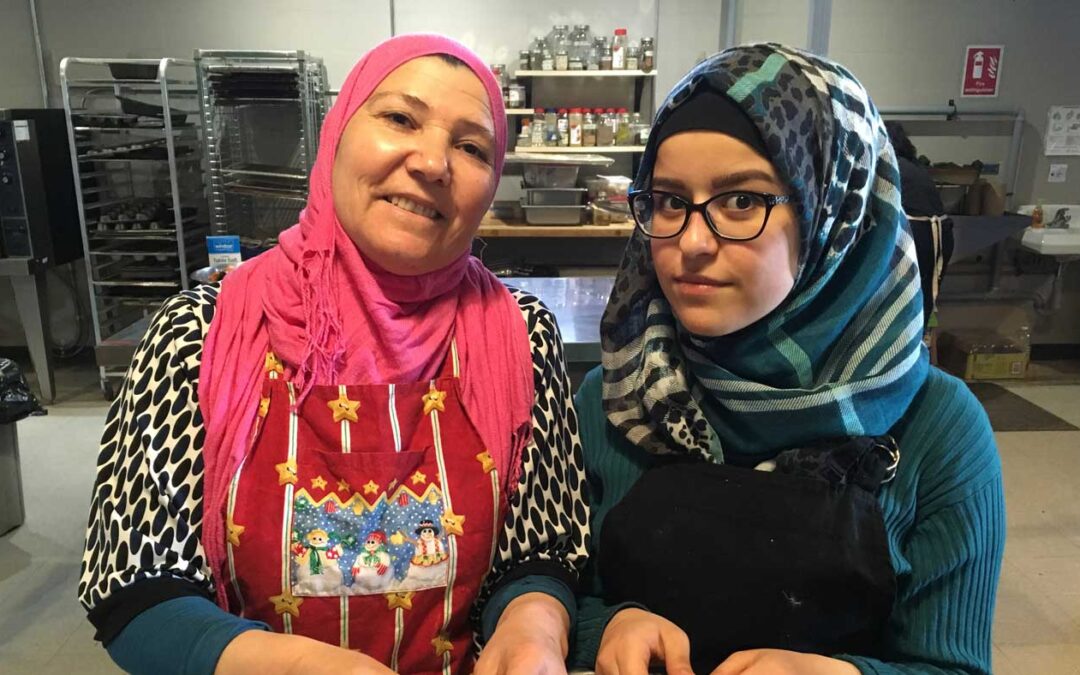
by weaver | Jan 14, 2023 | 2022 Report, Highlight
Roots Community Food Centre
A place for newcomer women to share their cooking with the local community and learn the skills and knowledge they need to start a food business from home.
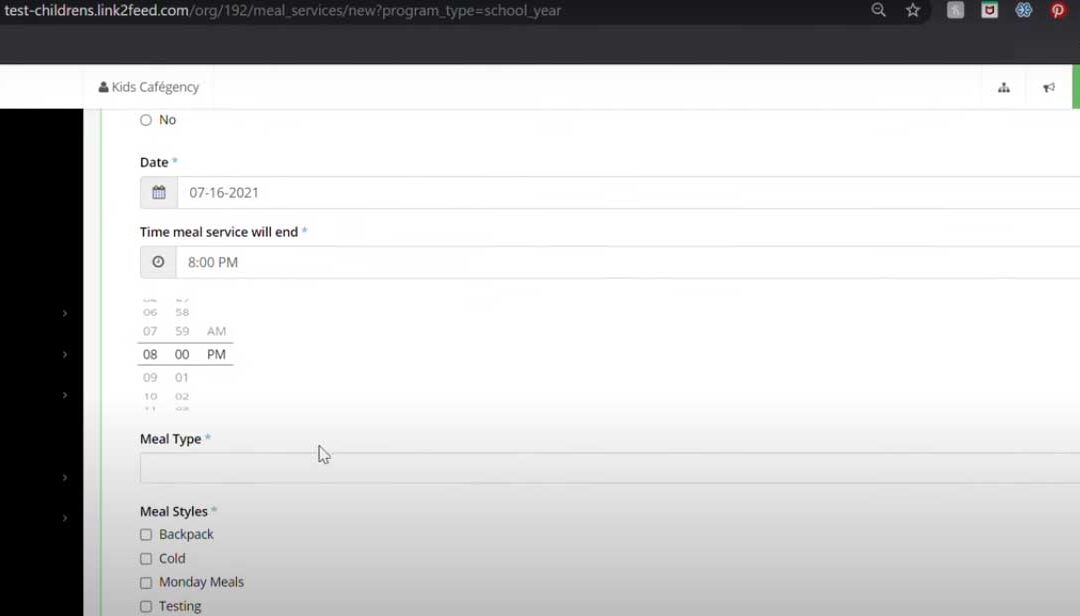
by weaver | Jan 14, 2023 | 2022 Report, Highlight
Regional Food Distribution Association (RFDA)
New software connects partner food banks to streamline services.
by weaver | Jan 14, 2023 | 2022 Report, Highlight
NorWest Community Health Centres, Roots Community Food Centre
A year-round fresh produce market offering wholesale prices to food insecure households.

by weaver | Jan 14, 2023 | 2022 Report, Analysis
Food Insecurity is a Result of Inequity and Poverty Food insecurity is primarily the result of inequity. This is most evident in the financial constraints too many people experience. Unprecedented inflation and rising costs of food, housing, transportation, etc.;...
by weaver | Jan 11, 2023 | 2022 Report, Indicator Data
15+ Measured: 2022 Source: Ng, Vincent. (2022). Thunder Bay District Health Unit. Personal Communication. 42
by weaver | Jan 11, 2023 | 2022 Report, Indicator Data
17 Measured: 2022 Source: Ng, Vincent. (2022). Thunder Bay District Health Unit. Personal Communication. 43
by weaver | Jan 11, 2023 | 2022 Report, Indicator Data
388 Measured: 2022 Source: Ng, Vincent. (2022). Thunder Bay District Health Unit. Personal Communication. 44
by weaver | Jan 11, 2023 | 2022 Report, Indicator Data
$1,358 Measured: 2021 Source: Thunder Bay District Health Unit. (2021). Hungry For Change in the Thunder Bay District.
by weaver | Jan 11, 2023 | 2022 Report, Indicator Data
$2,703 Measured: 2021 Source: Thunder Bay District Health Unit. (2021). Hungry For Change in the Thunder Bay District.
by weaver | Jan 11, 2023 | 2022 Report, Indicator Data
$396 Measured: 2021 Source: Thunder Bay District Health Unit. (2021). Hungry For Change in the Thunder Bay District.
by weaver | Jan 11, 2023 | 2022 Report, Indicator Data
5 Measured: 2022 Source: Thunder Bay and Area Food Strategy, Food Access Coalition. (2022). Where to Find Food in Thunder Bay Brochure. 31
by weaver | Jan 11, 2023 | 2022 Report, Indicator Data
14,279 Measured: 2021 Source: Carlin, Brendan. (2022). Regional Food Distribution Association. Personal Communication. 32
by weaver | Jan 11, 2023 | 2022 Report, Indicator Data
8324 Measured: 2021 Source: Scott, Sherry. (2021). Northwestern Ontario Women’s Centre. Personal Communication. 33
by weaver | Jan 11, 2023 | 2022 Report, Indicator Data
40 Measured: 2021 Source: Scott, Sherry. (2021). Northwestern Ontario Women’s Centre. Personal Communication. 34
by weaver | Jan 11, 2023 | 2022 Report, Indicator Data
65 (2019) Measured: Source: Ho, Ivan. (2022). Thunder Bay District Health Unit. Personal communication. 36
by weaver | Jan 11, 2023 | 2022 Report, Indicator Data
1747 lbs Measured: 2019 Source: Ho, Ivan. (2022). Thunder Bay District Health Unit. Personal communication. 37
by weaver | Jan 11, 2023 | 2022 Report, Indicator Data
1235lbs Measured: 2021 Source: Carlin, Brendan. (2022). Regional Food Distribution Association. Personal Communication. 38
by weaver | Jan 11, 2023 | 2022 Report, Indicator Data
67 Measured: 2021 Source: Carlin, Brendan. (2022). Regional Food Distribution Association. Personal Communication. 39
by weaver | Jan 11, 2023 | 2022 Report, Indicator Data
70 Measured: 2021 Source: McGibbon, Kim. (2022). Roots Community Food Centre. Personal Communication. 40
by weaver | Jan 11, 2023 | 2022 Report, Indicator Data
2 Measured: 2021 Source: McGibbon, Kim. (2022). Roots Community Food Centre. Personal Communication. 41
by weaver | Jan 11, 2023 | 2022 Report, Indicator Data
data unavailable
by weaver | Jan 11, 2023 | 2022 Report, Indicator Data
$3 Measured: 2022 Source: Thunder Bay Transit. (2022). https://www.thunderbay.ca/en/city-services/fares-and-passes.aspx 26
by weaver | Jan 11, 2023 | 2022 Report, Indicator Data
11% Measured: 2020 Source: Statistics Canada. 2017. 9
by weaver | Jan 11, 2023 | 2022 Report, Indicator Data
$77.50 Measured: 2022 Source: Thunder Bay Transit. (2022). https://www.thunderbay.ca/en/city-services/fares-and-passes.aspx 27