Food Infrastructure
Pillar Navigation
- What Are the Issues Around Food Infrastructure?
- Measures of access to local food
- Measure of distribution infrastructure
- Measures of local food processing
- Measures of employment
- Measures of farm input infrastructure
- Measures of food waste diversion
- What Do These Indicators Tell Us?
- Highlights
- References

GOAL:
Support the creation of a food supply chain that links regional production and harvesting to processing, distribution and marketing, consumption and waste management in ways that sustain the local economy, minimize environmental impact, increase equity, and improve people’s access to good food.
What Are The Issues Around Food Infrastructure In The Thunder Bay Area?
Developing an equitable and sustainable food system depends on strong and supportive infrastructure. Food storage, processing, and distribution services are integral parts of the infrastructure that move food from the farm, forest and watershed to our plates.
Only 70 years ago, most food consumed in the cities of Fort William and Port Arthur was grown in backyard gardens or on nearby farms, or hunted and foraged from the surrounding forests and lakes. Farmers and fishers sold directly to consumers, at farmers’ markets, or to distributors who supplied independent food stores. The regional food system began to change dramatically in the mid-20th century as the first supermarket opened here in the 1950s and the TransCanada Highway was completed through the area in the 1960s. Today, long-distance truck transportation has become the primary means of moving food, as transportation networks, food suppliers and distributors have become more globalized and as consumer buying has favoured big box food stores offering processed and fresh foods mainly from elsewhere.
Increasing interest in a more regionalized food system reflects greater awareness of the environmental, social and economic costs of a globalized food system. Trucking food from far away shifts benefits from the regional economy to elsewhere, while contributing to greenhouse gas emissions and a disconnect between residents and where their food comes from. Our increasingly industrialized food system has also left the Thunder Bay area without centralized storage and with very little food processing or agri-business infrastructure.
Agricultural economic impact studies in Canada and the U.S. have demonstrated many times over the income and employment gains to be made from strengthening local supply chains. Though highly dependent on the locale and commodity in question, buying local food has a multiplier effect of 1.4 to 2.6 throughout the wider economy. 1 The multiplier effect is the amount of local economic activity that is triggered by the purchase of any one item. Community economics tells us that the more a dollar circulates in a defined region, and the faster it circulates, the more economic and social stability it creates. It is estimated that if every household in Ontario spent $10 a week on regional food, we would have an additional $2.4 billion in our regional economy at the end of the year and create 10,000 new jobs. 2 In 2013, a multiplier workforce study found that the food production sector in Thunder Bay District has an average workforce multiplier effect of 1.7. This means that in Northwestern Ontario, every 1,000 jobs at local farms and food processors support 700 additional jobs indirectly among suppliers and retailers. The study also identified a need to address current infrastructure gaps, such as a regional distribution centre, processing facilities and storage in order to enhance the growth of the region’s food sector. 3
What is Food Infrastructure?
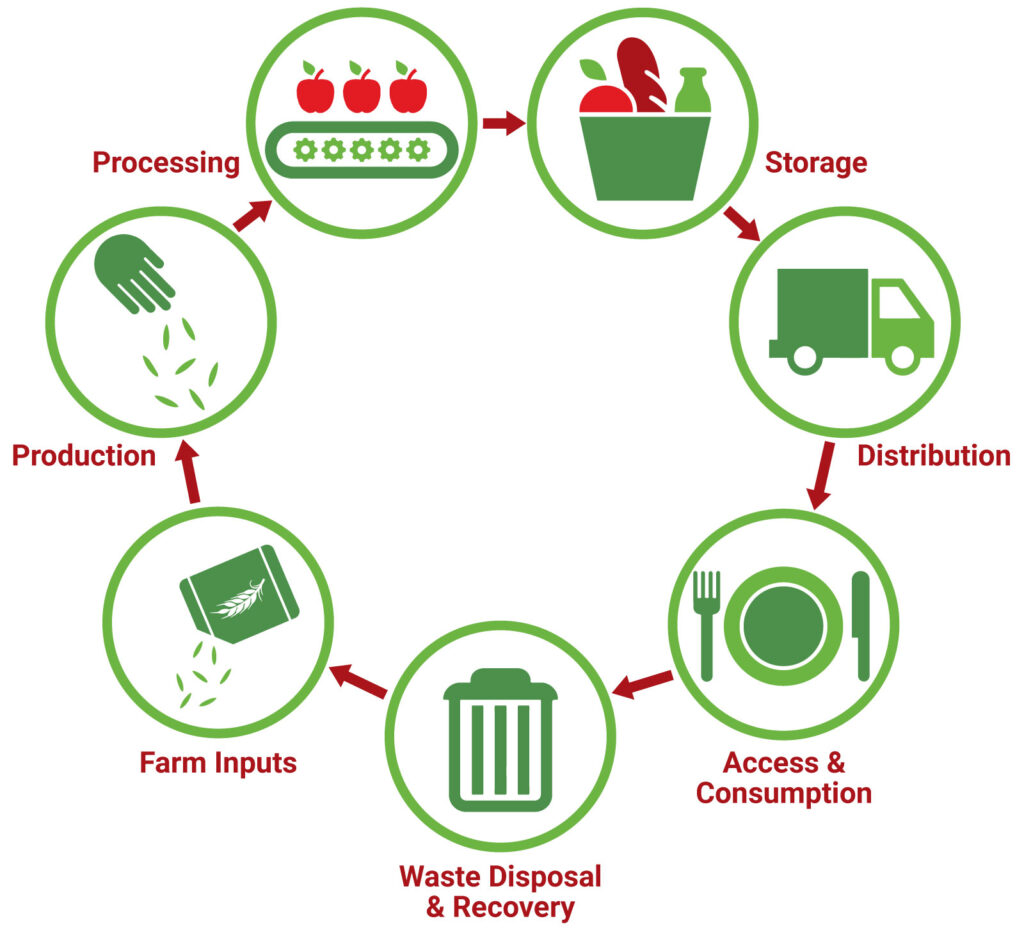
Production: the processes of growing, raising, and harvesting food.
Processing: the transformation of raw ingredients into food, or food into other food.
Storage: foods are stored at different points along the value chain, from on farm, to distribution warehouses, to home pantries.
Distribution: how food moves between different points in the food system.
Access & Consumption: how & where food is purchased or otherwise acquired, prepared, and eaten.
Waste Disposal & Recovery: food can be discarded, lost, or uneaten at any of the stages of production, processing, storage, distribution, and consumption.
Farm Inputs: the production, distribution, storage and sale of products needed to grow food.
Measures of access to local food
All indicators relate to data gathered in the Thunder Bay Census Metropolitan Area.
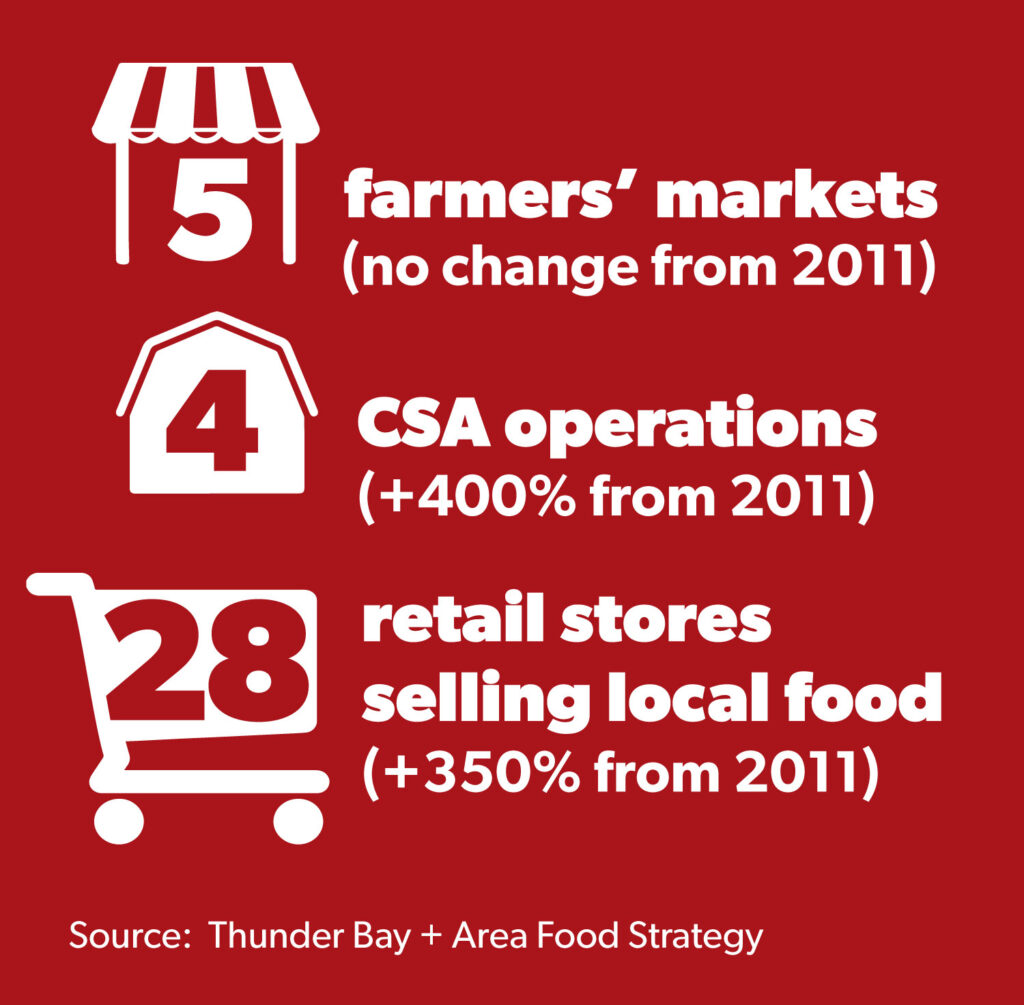
Number of community supported agriculture initiatives (2022)
4
Measured: 2022
Source: Thunder Bay + Area Food Strategy. (2022). Tbayinseason.ca Local Food Database. 4
Number of online ordering platforms for local food (2022)
5+
Measured: 2022
Source: Thunder Bay + Area Food Strategy. (2022). Tbayinseason.ca Local Food Database. 5
Number of farmers’ markets (2022)
5
Measured: 2022
Source: Thunder Bay + Area Food Strategy. (2022). Tbayinseason.ca Local Food Database. 6
Number of food and farming co-ops (2022)
1
Measured: 2022
Source: Donahue, Kendal. (2022). Ontario Ministry of Agriculture, Food and Rural Affairs. Personal Communication. 7
Number of retail stores stocking local food (2022)
28
Measured: 2022
Source: Thunder Bay + Area Food Strategy. (2022). Tbayinseason.ca Local Food Database. 8
Number of pick your own operations (2022)
3
Measured: 2022
Source: Thunder Bay + Area Food Strategy. (2022). Tbayinseason.ca Local Food Database. 9
Measure of distribution infrastructure
All indicators relate to data gathered in the Thunder Bay Census Metropolitan Area.
Number of food distributors (2022)
7
Measured: 2022
Source: Thunder Bay + Area Food Strategy. (2022). Community Food Security Database. 10
Measures of local food processing
All indicators relate to data gathered in the Thunder Bay Census Metropolitan Area.
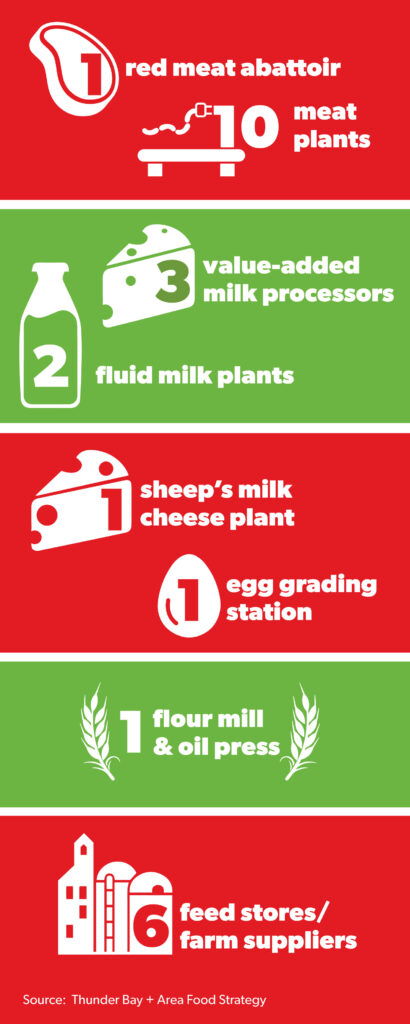
Number of abattoirs (2022)
1
Measured: 2022
Source: Ontario Ministry of Agriculture, Food and Rural Affairs. (2022). Provincially Licensed Meat Plants http://www.omafra.gov.on.ca/english/food/inspection/meatinsp/licenced_operators_list.htm 11
Number of poultry abattoirs (2022)
0
Measured: 2022
Source: Thunder Bay + Area Food Strategy. (2022). Community Food Security Database.
Number of businesses doing further meat processing (2022)
10
Measured: 2022
Source: Ontario Ministry of Agriculture, Food and Rural Affairs. (2022). -Provincially Licensed Meat Plants-http://www.omafra.gov.on.ca/english/food/inspection/meatinsp/licenced_operators_list.htm 12
Number of fluid milk processors (2022)
2
Measured: 2022
Source: Donahue, Kendal. (2022). Ontario Ministry of Agriculture, Food and Rural Affairs. Personal Communication. 13
Number of value-added milk processors (2022)
4
Measured: 2022
Source: Donahue, Kendal. (2022). Ontario Ministry of Agriculture, Food and Rural Affairs. Personal Communication. 14
Number of provincially licenced dairy plants (new for 2022)
4
Measured: 2022
Source: Ontario Ministry of Agriculture, Food and Rural Affairs. (2022). Provincially Liscensed Dairy Plants. http://www.omafra.gov.on.ca/english/food/inspection/dairy/licenseddairyplants.htm 15
Number of businesses milling flour (2022)
1
Measured: 2022
Source: Donahue, Kendal. (2022). Ontario Ministry of Agriculture, Food and Rural Affairs. Personal Communication. 16
Number of businesses pressing oil (2022)
1
Measured: 2022
Source: Donahue, Kendal. (2022). Ontario Ministry of Agriculture, Food and Rural Affairs. Personal Communication. 17
Number of businesses grading eggs (2022)
1
Measured: 2022
Source: Donahue, Kendal. (2022). Ontario Ministry of Agriculture, Food and Rural Affairs. Personal Communication. 18
Number of bakeries (2022)
30
Measured: 2022
Source: Thunder Bay + Area Food Strategy. (2022). Community Food Security Database. 19
Number of beverage/brewery/winery businesses (2022)
5
Measured: 2022
Source: Moore, Ryan. (2022). Community Economic Development Commission. Personal Communication. 20
Number of other local food processors (new for 2022)
18
Measured: 2022
Source: Thunder Bay + Area Food Strategy. (2022). Tbayinseason.ca Local Food Database. 21
Measure of employment
All indicators relate to data gathered in the Thunder Bay Census Metropolitan Area.
Jobs related to agriculture and agri-food production (2022)
6,095
Measured: 2021
Source: Ontario Ministry of Agriculture and Rural Affairs. (2022). County Profiles: https://www.ontario.ca/page/county-profiles-agriculture-food-and-business – Thunder Bay 10
Measures of farm input infrastructure
All indicators relate to data gathered in the Thunder Bay Census Metropolitan Area.
Number of feed stores (new for 2022)
6
Measured: 2022
Source: Donahue, Kendal. (2022). Ontario Ministry of Agriculture, Food and Rural Affairs. Personal Communication. 23
Measures of food waste diversion
All indicators relate to data gathered in the Thunder Bay Census Metropolitan Area.
Number of personal composters sold (2022)
296
Measured: 2021
Source: Moir, Erin. (2022). EcoSuperior Environmental Programs. Personal Communication. 24
Number of institutions diverting food waste (2022)
unknown
Measured: –
Source: Moir, Erin. (2022). EcoSuperior Environmental Programs. Personal Communication. 25
Number of vermi-composting workshops (2022)
2
Measured: 2021
Source: Moir, Erin. (2022). EcoSuperior Environmental Programs. Personal Communication. 26
Number of schools reached through vermi-composting workshops (2022)
2
Measured: 2021
Source: Moir, Erin. (2022). EcoSuperior Environmental Programs. Personal Communication. 27
Number of students engaged through vermi-composting workshops (2022)
32
Measured: 2021
Source: Moir, Erin. (2022). EcoSuperior Environmental Programs. Personal Communication. 28
What do the 2022 Food Infrastructure Indicators Tell Us?
Food Businesses and Employment
Local farms and food processing are an important component of our economy. According to the 2013 Thunder Bay Multiplier Study, “many jobs were lost in Ontario as a result of the economic depression since 2008. However, food production-related employment has been more or less stable as compared to other industries.” 29 The food processing and farming businesses also generate the highest annual revenue in Ontario and provide a significant number of both direct and indirect jobs. 30
Local Food Distribution & Access
Despite its value to the local economy, by and large, our food supply chain is not designed to accommodate local food and Thunder Bay’s food infrastructure reflects this. The great majority of the food consumed in Thunder Bay is produced elsewhere and trucked or flown in. Food tends to be aggregated by grocery chains and national food wholesalers in centres to the west of us like Winnipeg or Calgary before being shipped here for final delivery to grocery chains, local retailers, public sector institutions and restaurants. Some food is imported from the United States and southern Ontario via the Toronto Food Terminal. 31
With the exception of dairy farmers, who work within a national supply management system, most of Thunder Bay’s primary producers and harvesters operate on a small scale with no access to commercial infrastructure. Most local food is sold directly to consumers or, in a few cases, to restaurants, local retailers and public sector institutions.
Before the COVID pandemic, local restaurants and farmers’ markets were key marketing channels; however, two years of disruptions to businesses and changes in consumer habits have resulted in some loss of momentum. Some producers have pursued new relationships with locally-owned grocery and specialty food retailers to maintain their sales. This has, in some cases, resulted in them withdrawing from the use of shared marketing infrastructure like farmer’s markets.
The number of online ordering platforms for local food has increased, with more farms vending through their own websites, often promoting themselves through social media platforms. Web platforms are also being used to improve Community-Supported Agriculture (CSA) consumer experiences. CSA is a subscription model under which patrons pay farmers a set fee for a regular delivery of farm products through the subscription period. These new online systems automate sales and payments and let patrons customize orders before each pickup, which helps producers create efficiencies and increase margin. Thunder Bay’s first CSA farm reported in 2011; in 2021, four farms reported income from the CSA model. 32
A need was identified in the 2015 Report Card for more neighbourhood-level infrastructure, such as small-scale markets, that would make local food more accessible to communities, particularly low-income communities. Recent efforts between front-line organizations and health agencies are making progress on this, which can be seen in the development of new Community Food Markets and the related Market Greens Rx program and an increase in the number of people subscribing to the Good Food Box program. Learn more about these indicators under the Food Access pillar.
Local Food Processing & Storage
Some processing businesses are also essential points of food inspection. Without them, local producers cannot bring their products to market. For example, in Ontario, all raw milk is sold into and must be purchased from the supply management system by a licensed dairy plant and pasteurized before it can be consumed. All meat and poultry must pass through inspection immediately before and after slaughter, while eggs must be graded and inspected before they can be sold anywhere other than at the farm gate by the producer. The successful operation of these essential businesses is vulnerable to shortages of skilled labour, market fluctuations and, in some cases, increasing cost and administrative overhead generated by health and safety, animal welfare and traceability initiatives. Producers’ access to the market depends on their ability to access these businesses.
In addition to one dairy processing facility which engages with the supply management system through traditional channels, Thunder Bay supports one small dairy processor producing fluid milk and a variety of other dairy products, and another processor making cheese. These two operations are able to purchase milk from their own family farms through the supply management system. A third operation uses milk from the dairy system to produce frozen dairy products. There is also a processor producing sheep cheese, which is not governed by the dairy supply management system, from its own milking flock. 33
Most of Thunder Bay’s livestock farmers depend on one local Provincially-inspected slaughter facility which processes beef, pork, lamb, goat and rabbit and offers basic cutting and wrapping services. 34 Poultry processing is not available in Thunder Bay. The local abattoir serves farmers year-round, but its capacity has been challenged by the increasing number of seasonal operators seeking slaughter services in the fall and early winter. Seasonal overflow tends to be borne by the abattoirs in Oxdrift and Rainy River, which also offer poultry processing services.
Further-processing services for local meats including curing, smoking and sausage-making are available through ten businesses in Thunder Bay. 35 One egg-grading station operates in Thunder Bay. Owing to the lack of egg quota in this area, the largest flock in the Thunder Bay area is 500 hens 36, with other egg producers limited by supply management regulations to a maximum of 99 laying hens. The egg grading station services two egg producers year-round, with two or three additional seasonal customers. 37
Outside of the infrastructure for these regulated services, most of the post-harvest packing, processing and storage facilities used by Thunder Bay’s primary producers are located on their farms. Owing to the small scale of many operations, the amount of on-farm infrastructure is limited and tends to be held by year-round operations in higher revenue brackets.
There is one farming operation in Thunder Bay which operates a grain mill, 38 producing several kinds of flour from grain grown on the farm as well as value-added products like baking mixes. This business also operates an oil press 39 and produces canola oil from locally-grown canola seed.
In addition to producer-related infrastructure, there are other processor businesses establishing themselves in the market. Thunder Bay’s further-processors include bakeries, pasta and pasta sauce makers, condiment makers, coffee roasters, tea companies, meat processors and confectioners, among others. Some of these, like the condiment maker which now has products for sale all over North America, deliberately make contracts with local farmers to grow ingredients. Others purchase locally on an as-needed basis. Some processors are working with products which cannot be grown here; others choose not to use local products.
Many of the businesses doing value-added processing are small – generally ranging from part-time businesses to up to 20 full-time staff – but these businesses are thriving and there is potential for future growth and for new businesses to emerge and fill gaps in the market. There is also a need to inventory the diversity of businesses doing value-added processing so that the sector can better be tracked, understood and supported.
As of 2022, there are no commercial fish processing operations in the Thunder Bay area, although there is a home-based fish processing business in operation which works with local and regional fishers.
Farm Inputs
Primary producers rely on a number of inputs, including things like diesel, equipment, installation and repair services, fencing, construction materials, feed, seed and fertilizer. Although some of these inputs are widely available, some are specific to the agricultural sector and are supplied by specialty agricultural businesses. For example, Thunder Bay is home to at least 6 feed stores 40, including a farmers’ cooperative which also supplies other agricultural inputs.
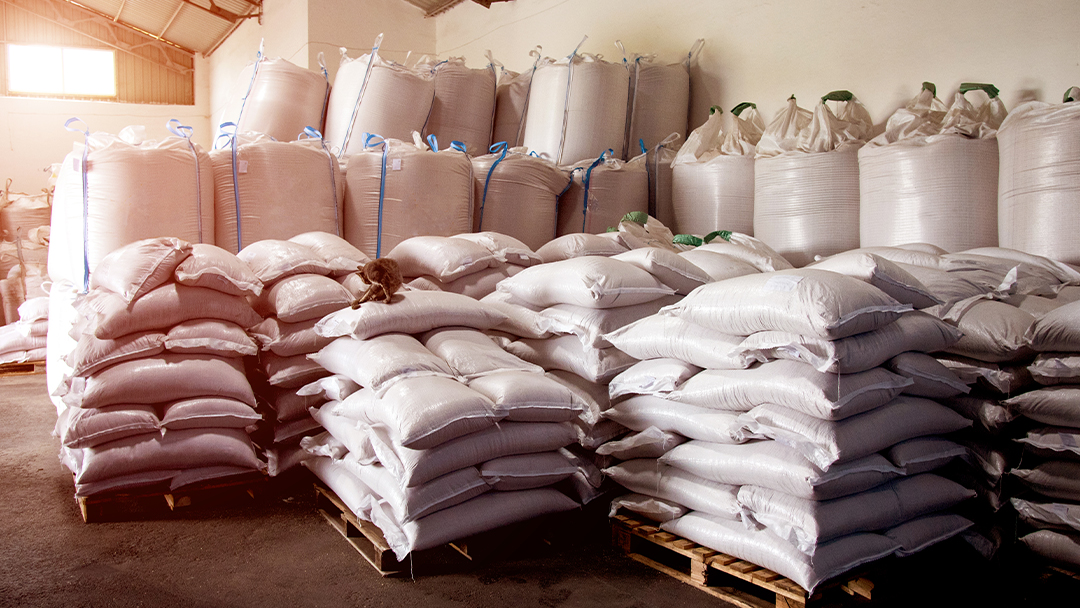
Farm inputs are supported by a variety of infrastructure. For example, suppliers may repack bulk orders, blend ingredients together, and store products in bulk until they are purchased. Larger farm operations often have on-farm versions of this infrastructure, particularly bulk storage set aside on-farm for diesel, feed, seed and fertilizer, while smaller operations tend to rely on supplier infrastructure to ensure products are available when needed.
Much of the infrastructure that supplies local processors has been developed as a result of the demand from local dairy farmers. The buying power of the dairy sector lets farm suppliers buy at preferred prices and helps to defray shipping costs, resulting in savings for all farmers. Destabilization of the dairy industry could have unintended consequences for farm suppliers, with cascading effects for the smaller operators who depend on them.
The infrastructure which supports, and is in turn supported by, primary producers is a complex web which is vulnerable to shortages of skilled labour, market fluctuations and changes to government policy as well as challenges like planning for business succession. There are still large holes in Thunder Bay’s food processing infrastructure, including, for instance, local services for processing poultry. One reason for this is that demand and supply both need to grow to a point where volumes justify the investment in new facilities and equipment.
Food Waste Diversion
An equitable and sustainable food system requires that waste is treated as a resource to be recycled back into agricultural production. National studies indicate that a lot of waste is generated across the food chain—from farm production, distribution and retail to consumption. More than 11.2 million metric tonnes or $49.46 billion worth of food is wasted every year in Canada. 41 Food manufacturing and processing is responsible for as much as 47% of the food wasted across the country. 24% of food waste happens on-farm. 14% of food waste is produced by individuals. Hotels, restaurants and institutions (HRI) are responsible for 9%, retailers 4% and the rest is lost at distribution facilities, food terminals, or during transportation. 42
Some Thunder Bay institutions, businesses, and individuals are diverting food waste; however, efforts are not coordinated or systemic and the amount diverted is a fraction of the overall amount of waste generated. There is an enormous opportunity to ramp up food waste management. By 2025, Thunder Bay will be instituting a curbside organic waste collection program to help divert 50% of household organic waste from the landfill. This is only a starting point to address household waste diversion. Waste streams at all levels of the value chain can be analyzed and tactics for strategic diversion can be implemented and coordinated among value chain participants.
Food Infrastructure Highlights
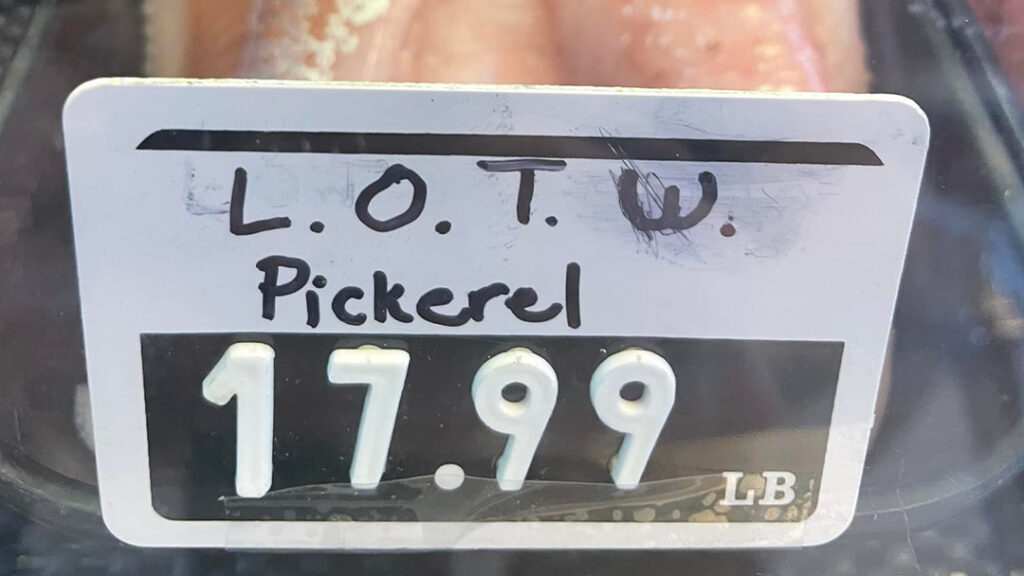
Processor/ retailer partnership makes regional fish more available
Eat the Fish, East Coast Seafood A new partnership between seafood retailer East Coast Seafood and local fish processor Eat the Fish has made locally-caught fish more accessible to the region. Typically, local commercial fishermen have sold their product to...
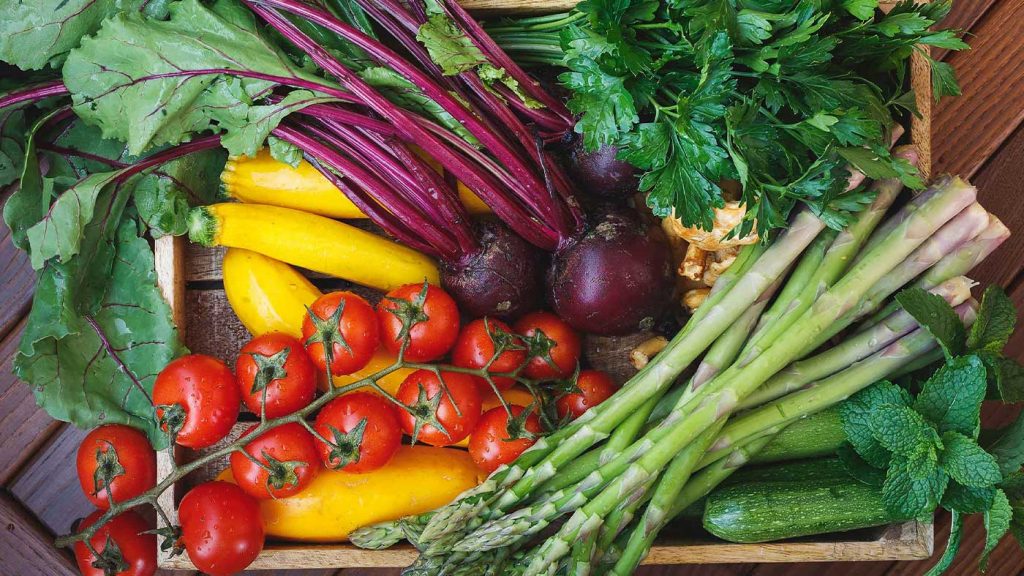
New online local food directory
tbayInSeason.ca offers one-stop information including seasonal harvest calendars, recipes and listings for local food producers, retailers and restaurants

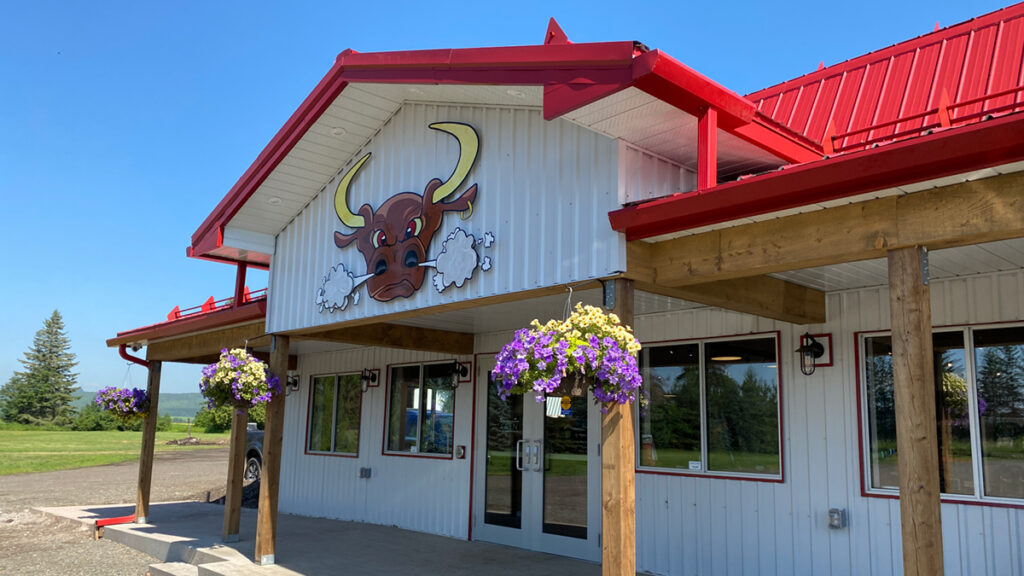
Thunder Bay Co-op Farm Supplies expands capacity, product lines
In the past two years the farmers' co-op has made two significant expansions to its operations.
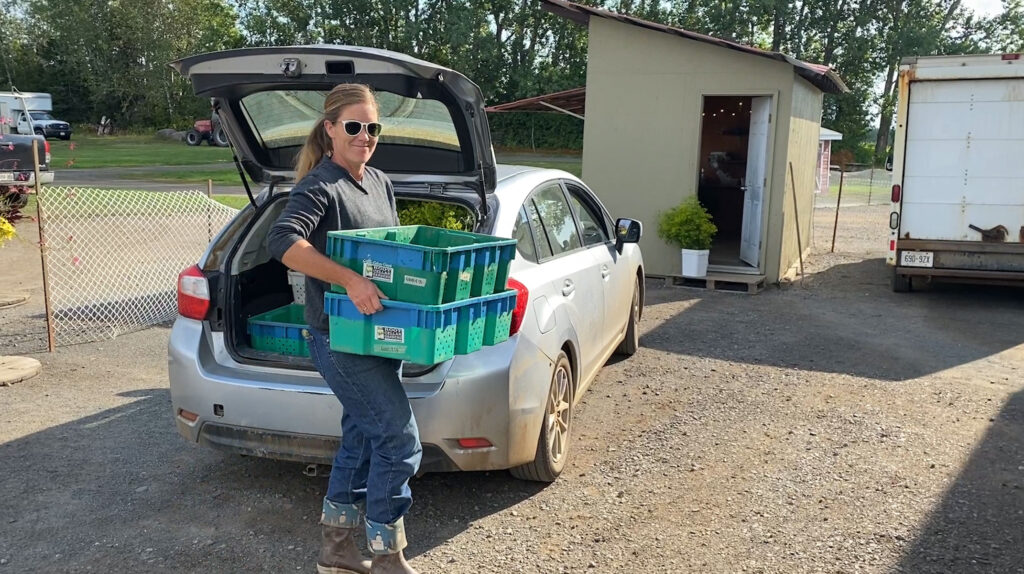
Superior Seasons Farmer’s Market supports small producers
online store and new retail location offer large selection of seasonal products
Community Supported Agriculture
Community Supported Agriculture (CSA) is a concept which has been steadily growing in popularity across North America over the past 30 years. In this community supported model, a farm receives a payment up-front for a coming season’s harvest. Once the farm starts...
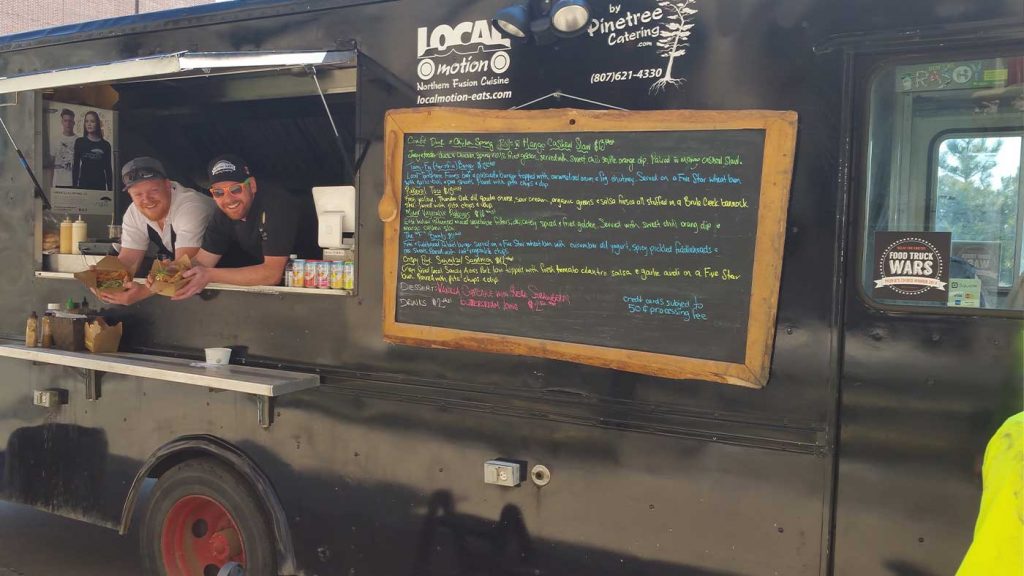
Food Trucks
In 2013, food trucks were the number one food trend in North America. It is no coincidence that 2013 also marked the year that Thunder Bay’s first food truck was up and running. By 2015, 6 food trucks were operating in the city, bringing fun and creative food to...
Sustainable New Agricultural Products & Productivity (SNAPP) Program
With an investment of $290,000 from FedNor and Industry Canada through the Northern Ontario Development Fund, the Sault Ste. Marie Innovation Centre and 3 northern partners (including Clover Valley Farmers’ Market of Fort Frances) conducted a pilot project in 2014...
2022 Food Infrastructure References
- Food Security Research Network and Faculty of Natural Resources Management, Lakehead University. (2013). The Workforce Multiplier Effect of Local Farms and Food Processors in Northwestern Ontario. Funded by the North Superior Workforce Planning Board and the Northwest Training and Adjustment Board.
- McGuinty, D., (2012). Shifting to Local Food will Create 10,000 Ontario Jobs.
- Food Security Research Network and Faculty of Natural Resources Management, Lakehead University. (2013). The Workforce Multiplier Effect of Local Farms and Food Processors in Northwestern Ontario. Funded by the North Superior Workforce Planning Board and the Northwest Training and Adjustment Board.
- Thunder Bay + Area Food Strategy. (2022). Tbayinseason.ca Local Food Database.
- Thunder Bay + Area Food Strategy. (2022). Tbayinseason.ca Local Food Database.
- Donahue, Kendal. (2022). Ontario Ministry of Agriculture, Food and Rural Affairs. Personal Communication.
- Thunder Bay + Area Food Strategy. (2022). Tbayinseason.ca Local Food Database.
- Thunder Bay + Area Food Strategy. (2022). Tbayinseason.ca Local Food Database.
- Thunder Bay + Area Food Strategy. (2022). Tbayinseason.ca Local Food Database.
- Thunder Bay + Area Food Strategy. (2022). Community Food Security Database.
- Ontario Ministry of Agriculture, Food and Rural Affairs. (2022). Provincially Licensed Meat Plants http://www.omafra.gov.on.ca/english/food/inspection/meatinsp/licenced_operators_list.htm
- Thunder Bay + Area Food Strategy. (2022). Community Food Security Database.
- Moore, Ryan. (2022). Community Economic Development Commission. Personal Communication.
- Ontario Ministry of Agriculture, Food and Rural Affairs. (2022). -Provincially Licensed Meat Plants-http://www.omafra.gov.on.ca/english/food/inspection/meatinsp/licenced_operators_list.htm
- Donahue, Kendal. (2022). Ontario Ministry of Agriculture, Food and Rural Affairs. Personal Communication.
- Donahue, Kendal. (2022). Ontario Ministry of Agriculture, Food and Rural Affairs. Personal Communication.
- Donahue, Kendal. (2022). Ontario Ministry of Agriculture, Food and Rural Affairs. Personal Communication.
- Donahue, Kendal. (2022). Ontario Ministry of Agriculture, Food and Rural Affairs. Personal Communication.
- Donahue, Kendal. (2022). Ontario Ministry of Agriculture, Food and Rural Affairs. Personal Communication.
- Ontario Ministry of Agriculture, Food and Rural Affairs. (2022). Provincially Licensed Dairy Plants. http://www.omafra.gov.on.ca/english/food/inspection/dairy/licenseddairyplants.htm
- Thunder Bay + Area Food Strategy. (2022). Tbayinseason.ca Local Food Database.
- Donahue, Kendal. (2022). Ontario Ministry of Agriculture, Food and Rural Affairs. Personal Communication.
- Donahue, Kendal. (2022). Ontario Ministry of Agriculture, Food and Rural Affairs. Personal Communication.
- Moir, Erin. (2022). EcoSuperior Environmental Programs. Personal Communication.
- Moir, Erin. (2022). EcoSuperior Environmental Programs. Personal Communication.
- Moir, Erin. (2022). EcoSuperior Environmental Programs. Personal Communication.
- Moir, Erin. (2022). EcoSuperior Environmental Programs. Personal Communication.
- Moir, Erin. (2022). EcoSuperior Environmental Programs. Personal Communication.
- Food Security Research Network and Faculty of Natural Resources Management, Lakehead University. (2013). The Workforce Multiplier Effect of Local Farms and Food Processors in Northwestern Ontario. Funded by the North Superior Workforce Planning Board and the Northwest Training and Adjustment Board.
- Food Security Research Network and Faculty of Natural Resources Management, Lakehead University. (2013). The Workforce Multiplier Effect of Local Farms and Food Processors in Northwestern Ontario. Funded by the North Superior Workforce Planning Board and the Northwest Training and Adjustment Board.
- Roy, R., (2014). Appendix E: Growth Opportunities in Thunder Bay’s Food Infrastructure, Research Report. Prepared by Beanstalk Consulting as part of the City of Thunder Bay and Food Action Network Broader Public Sector Education Strategy Implementation Project, Summary Report.
- Thunder Bay + Area Food Strategy. (2022). Tbayinseason.ca Local Food Database.
- Donahue, Kendal. (2022). Ontario Ministry of Agriculture, Food and Rural Affairs. Personal Communication.
- Ontario Ministry of Agriculture, Food and Rural Affairs. (2022). -Provincially Licensed Meat Plants-http://www.omafra.gov.on.ca/english/food/inspection/meatinsp/licenced_operators_list.htm
- Ontario Ministry of Agriculture, Food and Rural Affairs. (2022). -Provincially Licensed Meat Plants-http://www.omafra.gov.on.ca/english/food/inspection/meatinsp/licenced_operators_list.htm
- Jenny Groenheide. (2022). Tarrymore Farms. Personal Communication.
- Abby Vanlenthe. (2022). Thunder Bay Feeds/ Vanderwees Poultry Farms. Personal Communication.
- Donahue, Kendal. (2022). Ontario Ministry of Agriculture, Food and Rural Affairs. Personal Communication.
- Donahue, Kendal. (2022). Ontario Ministry of Agriculture, Food and Rural Affairs. Personal Communication.
- Donahue, Kendal. (2022). Ontario Ministry of Agriculture, Food and Rural Affairs. Personal Communication.
- Value Chain Management International. (2020). Less Food Loss and Waste, Less Packaging Waste. https://vcm-international.com/food-waste/food-waste-publications/
- Value Chain Management International. (2013). The Avoidable Crisis of Food Waste: Technical Report. https://vcm-international.com/food-waste/food-waste-publications/