Regional Food Production

GOAL:
Protect and encourage growth in farm-scale production so that a greater proportion of food is grown, raised, prepared, processed, and purchased closer to home.
What are the Issues Around Food Production in the Thunder Bay Area?
Agriculture is an important part of our food system. Crops and livestock provide most of our calories and proteins while agriculture and related industries play a crucial role in the life of our economy. Nationally, the food and farming sector accounts for 8% of the Gross Domestic Product and one in eight jobs. Within the province of Ontario, food and farming compete with the auto industry as the largest sector of the economy. 1
On average, food travels 3,500 km to reach Thunder Bay and the storage, refrigeration, packaging and transportation involved generates waste and consumes a large amount of fossil fuel. 2 The food system’s high energy inputs, such as fossil fuels and fertilizers account for almost a third of greenhouse gas emissions on a global scale. 3 Localizing food production would go a long way to reducing greenhouse gas emissions. At the same time, having a stronger farming sector would mean being less vulnerable to rising food costs associated with increasing energy prices, loss of agricultural land due to development and erosion, and the impacts of climate change—all of which threaten long-term access to imported food. 4
A strong local food system depends on a healthy, thriving community of local food producers. Yet for many farmers it is difficult to make a living from growing food. Between 1996 and 2006, for instance, the number of farmers in the Thunder Bay District seeking a second income increased from 33% to 47%. 5 One reason for this is the loss of local food infrastructure which means farmers have to incur higher costs to send their products further away to be processed. The rising cost of inputs (e.g. oil, fertilizers) and competition from foreign goods also make it harder to compete.
The viability of farming as a livelihood is particularly concerning if we consider that the farming population is aging (almost 50% of farmers in Canada are 55 or older) and many established farmers are retiring without successors. 6
A high dependence on imported goods results in a loss of food self-sufficiency as well as lost economic opportunities. Many regions in North America and Europe are therefore choosing to promote agriculture and food processing for local consumption as a way to enhance economic viability at the local and regional levels. In addition, equity of farm workers and sustainability is an essential component of the long-term survival of agricultural operations.
Agriculture is an important industry in Northwestern Ontario. The Thunder Bay District Agricultural Economic Impact Study (2009) found that farmers in the District reported a total of $32.3 million in gross farm receipts and directly supported 605 on-farm jobs, and many more in related industries. Employment in agriculture between 2001 and 2006 also remained relatively stable compared to other sectors of the economy, such as forestry and manufacturing, which experienced combined losses of over 2,500 jobs. 7 Producing more food in the area for sale in local markets would mean creating jobs, generating tax dollars, and having an impact on the wider economy through connections with other businesses, such as retail, manufacturing, construction, and transportation.
In addition to the economic benefits of agriculture, it is important to recognize the environmental and social benefits of local food systems. On the one hand, local food consumption tends to move consumers toward fresh foods and away from heavily processed foods that contain high amounts of sugar, salt, and fat. When managed in ecologically responsible ways, agricultural landscapes can provide a number of essential functions, including air and water purification, wetland and watershed protection, wildlife habitat, recreation, and open space. 8
What Counts as a Farm?
A significant conceptual change to the main statistical unit used by Statistics Canada’s Agriculture Statistics Program was introduced for the 2021 Census of Agriculture: a “farm” or an “agricultural holding” (i.e., the census farm) now refers to a unit that produces agricultural products and reports revenues or expenses for tax purposes to the Canada Revenue Agency. Before 2021, a “farm” was defined as an agricultural operation that produced at least one agricultural product intended for sale. 9
Farm operator characteristics
UNLESS OTHERWISE INDICATED, ALL INDICATORS RELATE TO DATA GATHERED IN THE DISTRICT OF THUNDER BAY.
Note: There are significant refinements in the geographic assignment of agricultural operations and changes in census consolidated subdivision boundaries between censuses. These assignment and boundary changes mean that caution should be taken when comparing the data between censuses. OMAFRA has formatted the information in this manner to the benefit of users to compare four census years.
Number of census farms (2022)
150
Measured: 2021
Source: Ontario Ministry of Agriculture and Rural Affairs. (2022). County Profiles: https://www.ontario.ca/page/county-profiles-agriculture-food-and-business – Thunder Bay 10
Number of farm operators (2022)
220
Measured: 2021
Source: Ontario Ministry of Agriculture and Rural Affairs. (2022). County Profiles: https://www.ontario.ca/page/county-profiles-agriculture-food-and-business – Thunder Bay 10
Number of farmer operators under 35 years of age (2022)
10
Measured: 2021
Source: Ontario Ministry of Agriculture and Rural Affairs. (2022). County Profiles: https://www.ontario.ca/page/county-profiles-agriculture-food-and-business – Thunder Bay 10
Number of farm operators between 35-54 years of age (2022)
80
Measured: 2021
Source: Ontario Ministry of Agriculture and Rural Affairs. (2022). County Profiles: https://www.ontario.ca/page/county-profiles-agriculture-food-and-business – Thunder Bay 10
Number of farm operators 55 years of age and over (2022)
125
Measured: 2021
Source: Ontario Ministry of Agriculture and Rural Affairs. (2022). County Profiles: https://www.ontario.ca/page/county-profiles-agriculture-food-and-business – Thunder Bay 10
Average age of farm operators (2022)
56
Measured: 2021
Source: Ontario Ministry of Agriculture and Rural Affairs. (2022). County Profiles: https://www.ontario.ca/page/county-profiles-agriculture-food-and-business – Thunder Bay 10
Estimated number of full-time farm operators (2022)
130
Measured: 2021
Source: Ontario Ministry of Agriculture and Rural Affairs. (2022). County Profiles: https://www.ontario.ca/page/county-profiles-agriculture-food-and-business – Thunder Bay 10
Estimated number of part-time farm operators (2022)
95
Measured: 2021
Source: Ontario Ministry of Agriculture and Rural Affairs. (2022). County Profiles: https://www.ontario.ca/page/county-profiles-agriculture-food-and-business – Thunder Bay 10
Number of acres in production (2022)
39,908
Measured: 2021
Source: Ontario Ministry of Agriculture and Rural Affairs. (2022). County Profiles: https://www.ontario.ca/page/county-profiles-agriculture-food-and-business – Thunder Bay 10
Average farm size (measured in acres) (2022)
266
Measured: 2021
Source: Ontario Ministry of Agriculture and Rural Affairs. (2022). County Profiles: https://www.ontario.ca/page/county-profiles-agriculture-food-and-business – Thunder Bay 10
Total gross farm receipts (2022)
$31,921,202
Measured: 2021
Source: Ontario Ministry of Agriculture and Rural Affairs. (2022). County Profiles: https://www.ontario.ca/page/county-profiles-agriculture-food-and-business – Thunder Bay 10
Jobs related to agriculture and agri-food production (2022)
6,095
Measured: 2021
Source: Ontario Ministry of Agriculture and Rural Affairs. (2022). County Profiles: https://www.ontario.ca/page/county-profiles-agriculture-food-and-business – Thunder Bay 10
Areas owned (measured in acres) (2022)
30,488 or 76%
Measured: 2021
Source: Ontario Ministry of Agriculture and Rural Affairs. (2022). County Profiles: https://www.ontario.ca/page/county-profiles-agriculture-food-and-business – Thunder Bay 10
Area rented/leased (measured in acres) (2022)
8,031 or 20%
Measured: 2021
Source: Ontario Ministry of Agriculture and Rural Affairs. (2022). County Profiles: https://www.ontario.ca/page/county-profiles-agriculture-food-and-business – Thunder Bay 10
What Do We Grow in Thunder Bay?
Alfalfa
Apples
Asparagus
Barley
Beef
Beets
Blueberries
Broccoli
Cabbage
Canola
Carrots
Cauliflower
Corn
Cucumbers
Garlic
Green beans
Green peas
Herbs
Kale
Lamb
Leeks
Lettuce
Oats
Onions
Pears
Peppers
Pork
Potatoes
Pumpkins
Raspberries
Rutabagas
Snap peas
Soybeans
Squash and zucchini
Strawberries
Sweet corn
Tomatoes
Turnips
Wheat
… and lots more!
Farm characteristics
UNLESS OTHERWISE INDICATED, ALL INDICATORS RELATE TO DATA GATHERED IN THE DISTRICT OF THUNDER BAY.
Note: There are significant refinements in the geographic assignment of agricultural operations and changes in census consolidated subdivision boundaries between censuses. These assignment and boundary changes mean that caution should be taken when comparing the data between censuses. OMAFRA has formatted the information in this manner to the benefit of users to compare four census years.
Number of farms producing hay/fodder crops (2022)
70
Measured: 2021
Source: Ontario Ministry of Agriculture and Rural Affairs. (2022). County Profiles: https://www.ontario.ca/page/county-profiles-agriculture-food-and-business – Thunder Bay 10
Number of farms engaged in dairy production (2022)
23
Measured: 2021
Source: Ontario Ministry of Agriculture and Rural Affairs. (2022). County Profiles: https://www.ontario.ca/page/county-profiles-agriculture-food-and-business – Thunder Bay 10
Number of farms engaged in beef cattle production (2022)
39
Measured: 2021
Source: Ontario Ministry of Agriculture and Rural Affairs. (2022). County Profiles: https://www.ontario.ca/page/county-profiles-agriculture-food-and-business – Thunder Bay 10
Number of sheep farms (2022)
2
Measured: 2021
Source: Ontario Ministry of Agriculture and Rural Affairs. (2022). County Profiles: https://www.ontario.ca/page/county-profiles-agriculture-food-and-business – Thunder Bay 10
Number of hog farms (2022)
2
Measured: 2021
Source: Ontario Ministry of Agriculture and Rural Affairs. (2022). County Profiles: https://www.ontario.ca/page/county-profiles-agriculture-food-and-business – Thunder Bay 10
Number of poultry and egg farms (2022)
5
Measured: 2021
Source: Ontario Ministry of Agriculture and Rural Affairs. (2022). County Profiles: https://www.ontario.ca/page/county-profiles-agriculture-food-and-business – Thunder Bay 10
Number of farms engaged in other farm animal husbandry (horses, bison, deer, elk, llamas, etc) (2022)
19
Measured: 2021
Source: Ontario Ministry of Agriculture and Rural Affairs. (2022). County Profiles: https://www.ontario.ca/page/county-profiles-agriculture-food-and-business – Thunder Bay 10
Number of farms involved in fruit production (2022)
3
Measured: 2021
Source: Ontario Ministry of Agriculture and Rural Affairs. (2022). County Profiles: https://www.ontario.ca/page/county-profiles-agriculture-food-and-business – Thunder Bay 10
Number of farms involved in vegetable production (2022)
8
Measured: 2021
Source: Ontario Ministry of Agriculture and Rural Affairs. (2022). County Profiles: https://www.ontario.ca/page/county-profiles-agriculture-food-and-business – Thunder Bay 10
Number of greenhouses (nurseries, floriculture, and vegetable) (2022)
14
Measured: 2021
Source: Ontario Ministry of Agriculture and Rural Affairs. (2022). County Profiles: https://www.ontario.ca/page/county-profiles-agriculture-food-and-business – Thunder Bay 10
Number of registered beekeepers (new for 2022)
130
Measured: 2022
Source: Rupert, Rob. (2022.) Ontario Ministry of Agriculture, Food and Rural Affairs. Personal Communication. 11
Number of Thunder Bay Beekeeper Association members (2022)
40+
Measured: 2021
Source: Browne, Bruce. (2022.) Thunder Bay Beekeepers Association. Personal Communication. 12
Varieties trialed by the Lakehead University Agricultural Research Station (2022)
206
Measured: 2020
Source: Singh, Tarlok. (2022). Lakehead University Agricultural Research Station. Summary of Research Results 2020. 13
Number of people producing seeds for sale through the Superior Seed Producers (2022)
5
Measured: 2020
Source: McGibbon, Kim. (2022). Roots Community Food Centre. Personal Communication. 14
Number of seed packets sold through Superior Seed Producers (new for 2022)
3,907
Measured: 2021
Source: McGibbon, Kim. (2022). Roots Community Food Centre. Personal Communication. 15
What do the 2022 Food Production Indicators Tell Us?
Farm Characteristics, Revenue and Land Use
Although there is a diverse variety of farms operating in the Thunder Bay District, of the $30.35 million in farm cash receipts generated in the region in 2021, $17.5 million (57.6%) came from dairy production, a supply-managed industry which accounts for 23 (15%) of the 150 farms in the area. Thunder Bay is also home to potato farms, market vegetable operations, beef and other livestock farms and mixed production farms as well as greenhouses, beekeepers and a few farms growing field grains and oilseeds for human consumption. 16
By acre, the single largest use of farmland is crop production, with 22,708 acres or 57% of area farmland being put to this use in 2021. 70 farms were involved in the production of hay/fodder crops. This too reflects the major role of the dairy sector; the three top crops produced are hay, barley and corn silage, which are all used by dairy farmers to feed their herds. Some dairy farms have also diversified into grains and oilseeds that they sell to a local grain terminal. 17

There are a few farms growing grains for human consumption or for seed. There is one local flour mill that produces partially-sifted, whole wheat and rye flour and has the capacity to clean grains as well. 18
Although the dairy industry leads in farm cash receipts, beef cattle operations are the most numerous. The number of beef farmers has more than doubled in the past ten years, from 19 to 39 farms, however the total number of cattle and calves reported has decreased by 1% and farm receipts for cattle and calves have decreased from $1.36 million to $0.8 million. 19
A significant portion of Thunder Bay’s local livestock production is seasonal, particularly among people producing hogs or chicken, which can be purchased as piglets or chicks and raised to market weight over the course of a summer.
Although there is no local infrastructure for slaughtering chicken, two local producers reported income in 2021 from a combined 3,031 birds, 20 raising their birds during the summer months and transporting them to be slaughtered at the nearest poultry processing facility in Oxdrift, 350 km west of Thunder Bay.
lthough Census data indicates that 2 farms in the district made the majority of their revenue from pork production, a total of 15 farms reported income from hogs. 21 However, according to the local abattoir, there are approximately 150 people processing hogs locally with many of them processing 20 – 30 animals a year. 22 These producers include year-round operators raising hogs in permanent buildings and an increasing number of seasonal operators raising them outdoors in fenced areas over the warmer months.
The increasing number of seasonal operators has had implications for the availability of meat processing services in the community, creating high demand in the fall months for the services of Thunder Bay’s only abattoir and the small number of further processors offering butchery, smoking and sausage-making, all of which are locally-owned small businesses facing limitations of infrastructure and labour force. 23
There has not been a large producer of eggs in the area since 2014, although some farms produce eggs for sale at the farm gate and at small businesses in the region. Of the 32 farms reporting laying hens, one mixed farming operation is permitted a flock of 500 hens under a grandfather clause of the industry’s supply management regulations. 24 The others are limited to the 99 birds permitted to farms without egg quota. A total of 1,959 laying hens were reported by farms in the area in 2021. 25
In order to be retailed or sold beyond the farm gate (e.g., at a farmers’ market), eggs must be graded at a provincially- or federally-inspected facility. In 2022, two local producers have eggs graded at Thunder Bay’s egg grading station throughout the year, while an additional three producers use the service on a seasonal basis. 26
In addition to dairy, beef, hogs and chicken, ten farms reported keeping sheep and lambs, down from the 24 reporting in 2011. 27 There are also operations engaged in other farm animal husbandry, including horses, llamas and a new venture which is raising bison for meat.
Thunder Bay’s relatively short growing season makes vegetable farming challenging. In 2021, 16 farms reported engaging in vegetable production, growing a total of 26 acres in vegetables. The top reported vegetables – excluding potatoes, which are considered a field crop and counted separately – included carrots, beets, tomatoes, shallots & green onions, and garlic. The numbers indicate that market vegetable production tends to take place on a very small scale in the area, with the average farm growing 1.625 acres of vegetables. 28
The greenhouse sector in this area has changed significantly in the past ten years. Although there are a number of producers using greenhouses for both season extension and season enhancement, there was over 75% less greenhouse space reported in use in 2021 compared to 2011. 29 The decline in greenhouse acreage is mainly due to the reduced numbers of operations growing tree seedlings. 30
Much of the variety in Thunder Bay’s farm industry is supplied by farms reporting less than $24,999 in farm receipts. These operations account for 48% of area farms. They tend to include mixes of fruit, vegetable and livestock production, and tend to be typified by part-time farmers with off-farm income. These are frequently either hobbyists or newer farmers. This group has seen a significant reduction in numbers since 2011, decreasing from 157 to 69 in 2021. 31 Farms earning this level of income typically operate seasonally, with minimal on-farm infrastructure on smaller parcels of land, do not achieve economies of scale or significant mechanization and are vulnerable to rising input costs and lagging food prices.

Farms in this area which generate enough income to support full-time farmers tend to be characterized by a higher degree of mechanization as well as on-farm infrastructure which supports year-round operations. This can include buildings for sheltering livestock, greenhouses, hoop-houses and tunnels for vegetable season extension, climate-controlled spaces for crop or meat storage, equipment for value-added processing and housing for seasonal staff.
The local potato-farming numbers illustrate this point. In Thunder Bay potatoes are grown on both a market-garden scale by a number of mixed farming operations and a significant scale by two potato farms. These larger operations have mechanized much of their field-work and have developed on-farm infrastructure that includes climate-controlled storage, washing and packing and some further processing equipment. They have a variety of relationships, dealing directly with many local restaurants as well as wholesale retail channels, and their products may be found in various local and chain retail grocery stores throughout the region.


Changes Over Time
The number of farms operating and the amount of farmland in use continue to decrease in this area. This aligns with a greater trend; Ontario overall has seen decreases of 7% in the past ten years for both these indicators, while Northern Ontario has lost 21% of its farms and 23% of its farmland. The Thunder Bay Area had 37% fewer farms operating in 2021 than 2011 and had 32% less farmland in production. 32 Dairy farming, the top-grossing farm sector, has remained relatively stable in the area over the past 10 years. Although Census data shows the number of dairy farms decreasing from 29 in 2011 to 23 in 2021, the average farm size has increased and farm cash receipts for the sector have grown by nearly $4 million in the same period, 33 which means that the remaining dairy farmers are continuing to grow their operations.Despite the losses in farm numbers and farmland in use, total farm cash receipts for the area have remained about the same, in large part due to the relative stability of the dairy industry. The lack of growth in overall farm cash receipts in the district differs from the trends in Northern Ontario and Ontario overall, as well as our neighbouring districts. With the exception of Greater Sudbury, other Northern Ontario districts have seen growth ranging from 29% (Algoma) to 373% (Sudbury), while Thunder Bay has seen a growth of 1.95% in total farm cash receipts. 34
Farmland in the Thunder Bay District remains relatively affordable. In 2021, average prices for farmland in Ontario increased by 22.2%, the highest average increase reported among the provinces. 35 The lowest average farmland value increase was in the Northern Ontario region at 5.8%. Prices remained lower in this region, often a small fraction of the price of land in other parts of the province. 36

Value Chain Participation
With the exception of the supply-managed dairy industry, there is limited producer participation in longer value chains in this area. As mentioned above, the two major producers of potatoes participate both in direct local relationships with distributors and retailers as well as in a value chain that places their products in national grocery retailers, but few other farms are operating at wholesale scale.
As a result, most local food is sold directly to customers. Before the onset of the COVID-19 pandemic, local restaurants and farmers’ markets were key marketing channels; however, disruptions to businesses and changes to consumer spending and consumption habits have resulted in some loss of momentum. Some farm operators have pursued new relationships with local grocery and food retailers to maintain their sales, and this has in some cases resulted in them withdrawing from the use of shared marketing infrastructure like farmer’s markets.
There has been growth in the number of farms earning revenue through Community-Supported Agriculture (CSA), a subscription model under which patrons pay farmers a set fee for a regular delivery of vegetables through the subscription period. Thunder Bay’s first CSA farm reported in 2011; in 2021, four farms reported income from the CSA model. 37
There are currently no measures of assessing growth in demand or supply, although some attempts have been made to list suppliers and buyers. The Get Fresh! Guide was a voluntary-participation directory of local food business last published in 2017, which was replaced in 2021 by tbayInSeason.ca, an online directory developed by the Thunder Bay + Area Food Strategy. Although it provides a sense of the number of retailers and restaurants sourcing local food, the directory is not comprehensive.
According to tbayInSeason.ca, 15 restaurants and caterers and 20 retail locations are purchasing food from the Thunder Bay Area. The amount of food bought varies considerably by business and by season.
Regional Food Production Highlights

Farm partnership helped support mental health and farm sustainability during pandemic
The partnership has let the two farms tackle problem-solving together and give each other much-needed social support during pandemic social distancing.
Affordable land and welcoming community attract new farmers to region
Affordable farmland prices made Thunder Bay an attractive option to explore but it was the welcome they received from the farm community that made them decide to make their home here.

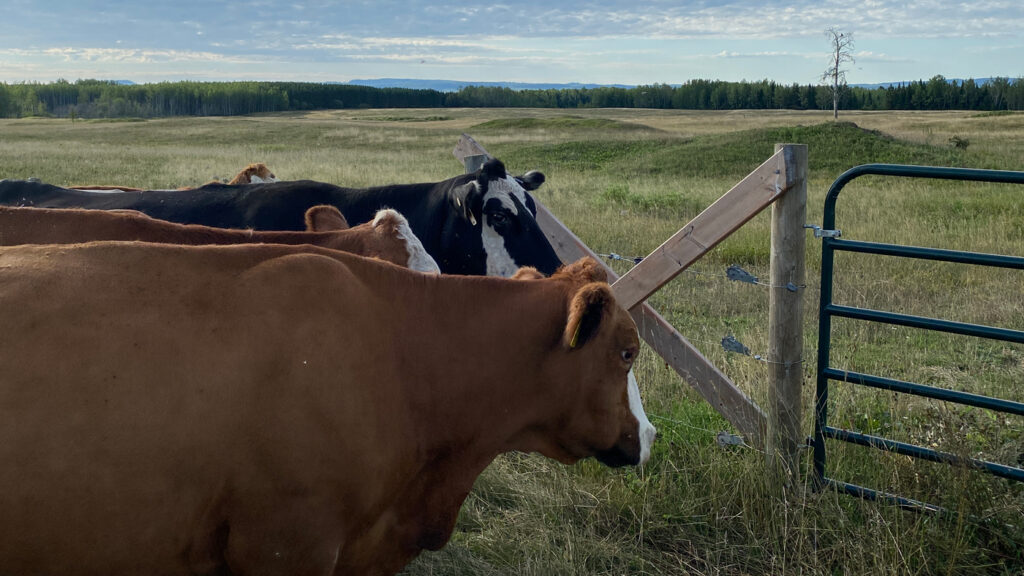
Thunder Bay Community Pasture develops drought-tolerant rotational grazing system thanks to government funding
Thunder Bay Community Pastures received a grant of $90,000 from the Federal and Provincial governments in 2021 to create a rotational grazing system through the installation of new interior fencing and gating.

Superior Seed Producers
Superior Seed Producers is a collective of local Thunder Bay Area growers who promote the saving and distribution of locally adapted, sustainably grown, open-pollinated non-GMO seeds in northwestern Ontario, while educating and supporting those who want to learn...
Growing Policy Support in 2015
The policy environment has become increasingly supportive of the agri-food sector in recent years. Changes in the Funding Landscape: A growing number of economic development organizations and granting bodies at the municipal, provincial, and federal levels of...

Thunder Bay Beekeepers Association
The Thunder Bay Beekeepers’ Association provides its members with a forum for sharing knowledge in beekeeping, and is dedicated to educating and promoting the benefits of beekeeping to the public. This past year they have been investigating techniques to reduce...
2022 Food Production References
- Agriculture and Agri-Food Canada. (2013). An Overview Of The Canadian Agriculture And Agri-Food System 2012.
- C. Schwartz-Mendez, Thunder Bay District Health Unit, February 18, 2014, Personal Communication.
- Consultative Group on International Agricultural Research. (2013). Food Emissions Fact Sheet.
- Miller, S. (2013). Places to farm.
- Harry Cummings and Associates Inc. (2009). Thunder Bay District Agricultural Economic Impact Study.
- Statistics Canada. (2014). Demographic Changes In Canadian Agriculture.
- Harry Cummings and Associates Inc. (2009). Thunder Bay District Agricultural Economic Impact Study.
- Baker, L., Campsie, P., & Rabionwicz, K. (2010). Menu 2020: Ten Good Food Ideas For Ontario. Prepared for the Metcalf Foundation.
- Census of Agriculture, 2021. Guide to the Census of Agriculture. https://www150.statcan.gc.ca/n1/pub/32-26-0002/322600022021001-eng.htm#b1
- Ontario Ministry of Agriculture and Rural Affairs. (2022). County Profiles: https://www.ontario.ca/page/county-profiles-agriculture-food-and-business – Thunder Bay
- Rupert, Rob. (2022.) Ontario Ministry of Agriculture, Food and Rural Affairs. Personal Communication.
- Browne, Bruce. (2022.) Thunder Bay Beekeepers Association. Personal Communication.
- Singh, Tarlok. (2022). Lakehead University Agricultural Research Station. Summary of Research Results 2020.
- McGibbon, Kim. (2022). Roots Community Food Centre. Personal Communication.
- McGibbon, Kim. (2022). Roots Community Food Centre. Personal Communication.
- Ontario Ministry of Agriculture and Rural Affairs. (2022). County Profiles: https://www.ontario.ca/page/county-profiles-agriculture-food-and-business – Thunder Bay
- Ontario Ministry of Agriculture and Rural Affairs. (2022). County Profiles: https://www.ontario.ca/page/county-profiles-agriculture-food-and-business – Thunder Bay
- Ontario Ministry of Agriculture and Rural Affairs. (2022). County Profiles: https://www.ontario.ca/page/county-profiles-agriculture-food-and-business – Thunder Bay
- Ontario Ministry of Agriculture and Rural Affairs. (2022). County Profiles: https://www.ontario.ca/page/county-profiles-agriculture-food-and-business – Thunder Bay
- Ontario Ministry of Agriculture and Rural Affairs. (2022). County Profiles: https://www.ontario.ca/page/county-profiles-agriculture-food-and-business – Thunder Bay
- Ontario Ministry of Agriculture and Rural Affairs. (2022). County Profiles: https://www.ontario.ca/page/county-profiles-agriculture-food-and-business – Thunder Bay
- Eleanora Vellinga, Thunder Bay Meat Processing, 2022. Personal communication.
- Eleanora Vellinga, Thunder Bay Meat Processing, 2022. Interview.
- Jenny Groenheide. (2022). Tarrymore Farms. Personal Communication.
- Ontario Ministry of Agriculture and Rural Affairs. (2022). County Profiles: https://www.ontario.ca/page/county-profiles-agriculture-food-and-business – Thunder Bay
- Abby Vanlenthe, Thunder Bay Feeds/ Vanderwees Farms, 2022. Personal communication.
- Ontario Ministry of Agriculture and Rural Affairs. (2022). County Profiles: https://www.ontario.ca/page/county-profiles-agriculture-food-and-business – Thunder Bay
- Ontario Ministry of Agriculture and Rural Affairs. (2022). County Profiles: https://www.ontario.ca/page/county-profiles-agriculture-food-and-business – Thunder Bay
- Ontario Ministry of Agriculture and Rural Affairs. (2022). County Profiles: https://www.ontario.ca/page/county-profiles-agriculture-food-and-business – Thunder Bay
- Donahue, Kendal. (2022). Ontario Ministry of Agriculture, Food and Rural Affairs. Personal Communication.
- Ontario Ministry of Agriculture and Rural Affairs. (2022). County Profiles: https://www.ontario.ca/page/county-profiles-agriculture-food-and-business – Thunder Bay
- Ontario Ministry of Agriculture and Rural Affairs. (2022). County Profiles: https://www.ontario.ca/page/county-profiles-agriculture-food-and-business https://data.ontario.ca/dataset/ontario-farm-data-by-county – Thunder Bay
- Ontario Ministry of Agriculture and Rural Affairs. (2022). County Profiles: https://www.ontario.ca/page/county-profiles-agriculture-food-and-business https://data.ontario.ca/dataset/ontario-farm-data-by-county – Thunder Bay
- Ontario Ministry of Agriculture and Rural Affairs. (2022). County Profiles: https://www.ontario.ca/page/county-profiles-agriculture-food-and-business https://data.ontario.ca/dataset/ontario-farm-data-by-county – Thunder Bay
- 2021 FCC Farmland Values Report
- Ontario Ministry of Agriculture and Rural Affairs. (2022). County Profiles: https://www.ontario.ca/page/county-profiles-agriculture-food-and-business https://data.ontario.ca/dataset/ontario-farm-data-by-county – Thunder Bay
- Thunder Bay + Area Food Strategy. (2022). Tbayinseason.ca Local Food Database.