
by weaver | May 10, 2022 | Context
Forest and freshwater foods — such as blueberries, mushrooms, tea, wild rice, fiddleheads, medicinal plants, wild fish and game — have been integral to the Northwestern Ontario food system for thousands of years. The activities involved in procuring forest and...
by weaver | May 5, 2022 | 2022 Report, References
Government of Canada. (2022). Household Food Insecurity in Canada. Retrieved from:...

by weaver | May 3, 2022 | 2015 Report, Highlight
Administered through the Red Cross since 1997, Student Nutrition Programs offer food programs in 86 of the schools in the District of Thunder Bay and 52 in the Thunder Bay area. The large majority of the programs serve breakfast or a morning snack. The food is...

by weaver | May 3, 2022 | 2015 Report, Highlight
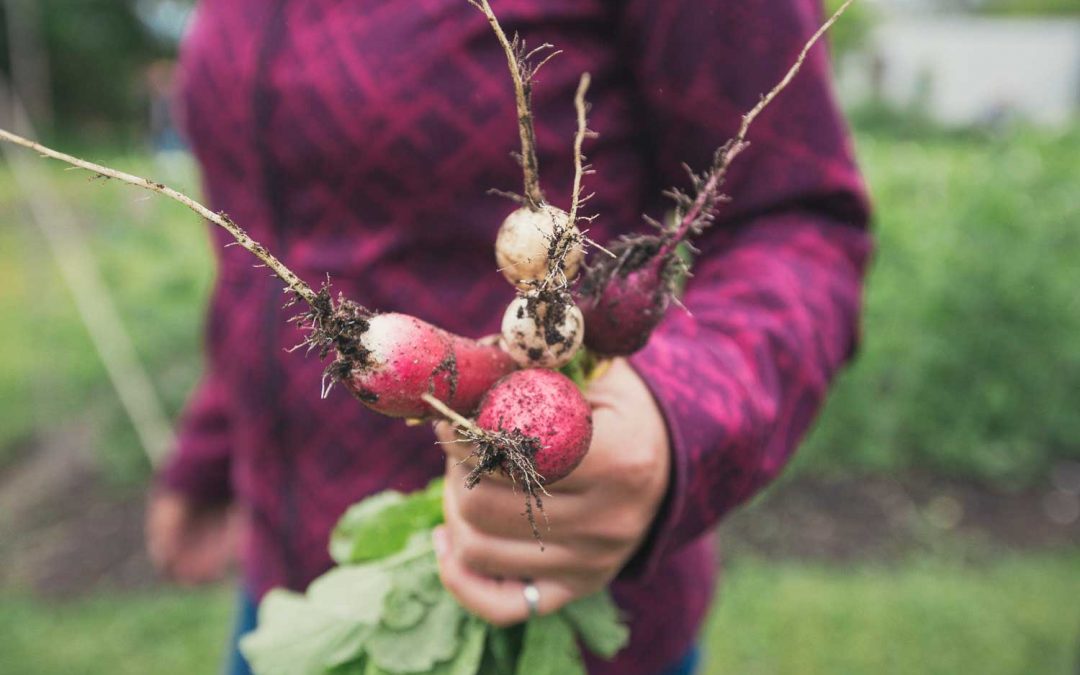
The Thunder Bay District Health Unit and Food Action Network have been running a Gleaning Program since 2000. The program provides free bus transportation to area farms to pick produce for people who have difficulty accessing food. Number of poultry abattoirs (2015)0...

by weaver | May 3, 2022 | 2015 Report, Highlight
The Thunder Bay Good Food Box is a monthly fruit and vegetable distribution program that aims to increase access to fresh and affordable produce in neighbourhoods, housing buildings, organizations, and participating First Nations year-round. The non-profit, volunteer...
by weaver | May 3, 2022 | 2015 Report, Highlight
Fresh food is not always easy to find in urban areas or at an affordable price. Since 2013, Roots to Harvest has run a mobile food market to give people living on a low income the ability to purchase high quality, locally grown, fresh produce. Located at the Water...
by weaver | May 3, 2022 | 2015 Report, Indicator Data
1400lbs of meat 84 families Measured: 2014 Source: Shkoday Abinojiiwak Obimiwedoon Aboriginal Head Start. (2014). 39
by weaver | May 3, 2022 | 2015 Report, Indicator Data
8 Measured: 2015 Source: Schwartz-Mendez C., (2015). Thunder Bay District Health Unit. 38
by weaver | May 3, 2022 | 2015 Report, Indicator Data
1,148 Measured: 2015 Source: Schwartz-Mendez, C., (2015). Thunder Bay District Health Unit. 34
by weaver | May 3, 2022 | 2015 Report, Indicator Data
7,600 lbs Measured: 2015 Source: Schwartz-Mendez, C., (2015). Thunder Bay District Health Unit. 33
by weaver | May 3, 2022 | 2015 Report, Indicator Data
218 Measured: 2015 Source: Schwartz-Mendez, C., (2015). Thunder Bay District Health Unit. 32
by weaver | May 3, 2022 | 2015 Report, Indicator Data
33 Measured: 2015 Source: O’Reilly, G., (2015). Northwestern Ontario Women’s Centre. 30
by weaver | May 3, 2022 | 2015 Report, Indicator Data
4,568 family sized boxes748 single sized boxes Measured: 2014 Source: O’Reilly, G., (2015). Northwestern Ontario Women’s Centre. 29
by weaver | May 3, 2022 | 2015 Report, Indicator Data
9,000 Measured: March 2015 Source: Carlin, B., (2015). Regional Food Distribution Association. 26
by weaver | May 3, 2022 | 2015 Report, Indicator Data
7 Measured: 2015 Source: Carlin, B., (2015). Regional Food Distribution Association. 25
by weaver | May 3, 2022 | 2015 Report, Indicator Data
3,447 Measured: March 2015 Source: Carlin, B., (2015). Regional Food Distribution Association. 24
by weaver | May 3, 2022 | 2015 Report, Indicator Data
19 Measured: 2015 Source: Carlin, B., (2015). Regional Food Distribution Association. 23
by weaver | May 3, 2022 | 2015 Report, Indicator Data
$875 Measured: 2015 Source: Thunder Bay District Health Unit. (2015). 22
by weaver | May 3, 2022 | 2015 Report, Indicator Data
$75.50 Measured: 2015 Source: Hendel, J., (2015). Thunder Bay Transit. 21
by weaver | May 3, 2022 | 2015 Report, Indicator Data
$2.61 Measured: 2015 Source: Hendel, J., (2015). Thunder Bay Transit. 20
by weaver | May 3, 2022 | 2015 Report, Indicator Data
8.8% Measured: 2013 – 2014 Source: Statistics Canada. (2011) 19
by weaver | May 3, 2022 | 2015 Report, Indicator Data
65.5% Measured: 2013 – 2014 Source: Statistics Canada. 18
by weaver | May 3, 2022 | 2015 Report, Indicator Data
25.3% Measured: 2013 – 2014 Source: Statistics Canada. 17
by weaver | May 3, 2022 | 2015 Report, Indicator Data
34.4% Measured: 2013 – 2014 Source: Statistics Canada. 16
by weaver | May 3, 2022 | 2015 Report, Indicator Data
10.2% Measured: 2013 – 2014 Source: Canadian Community Health Survey, 2013-2014 15